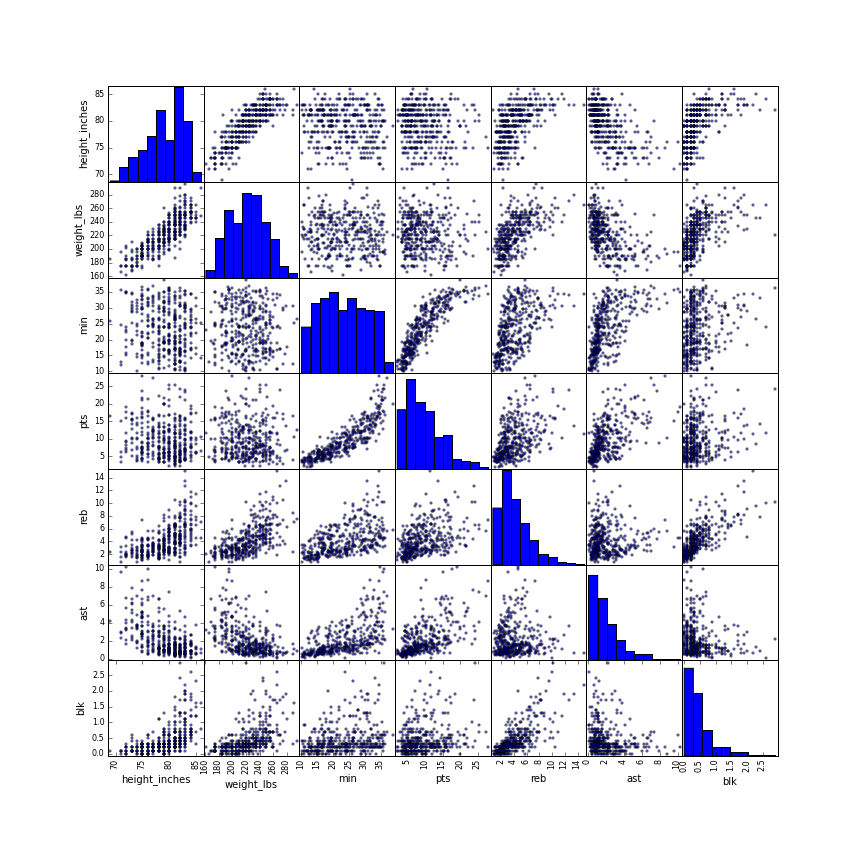
Getting familiar with pandas and plotting a scatter matrix of NBA player stats.
I spent an hour flipping through Python for Data Analysis to see if anything caught my eye given I've spent some type with IPython notebooks, numpy and a little pandas, and in fact it became clear there's a way easier way to do some of the exploratory scatterplots that I was doing by hand yesterday. Here's another notebook using a pandas data frame to load in the same nba player data set and quickly exploring two variable relationships using a scatter matrix.
I was avoiding using pandas for csv munging because it seemed like overkill, but I'm coming to appreciate its use even for a single csv; exploring a table of data is one of the things pandas is really built for.
And now back to the python ML book for the rest of the day where we update the perceptron training to use gradient descent.