Two variable exploratory data analysis (scatter plots)
To solidify the two variable analysis concepts from earlier in the week, spent some time looking at Q->Q comparison of player stats from the 2014-2015 NBA season (spent some time Monday getting the data set).
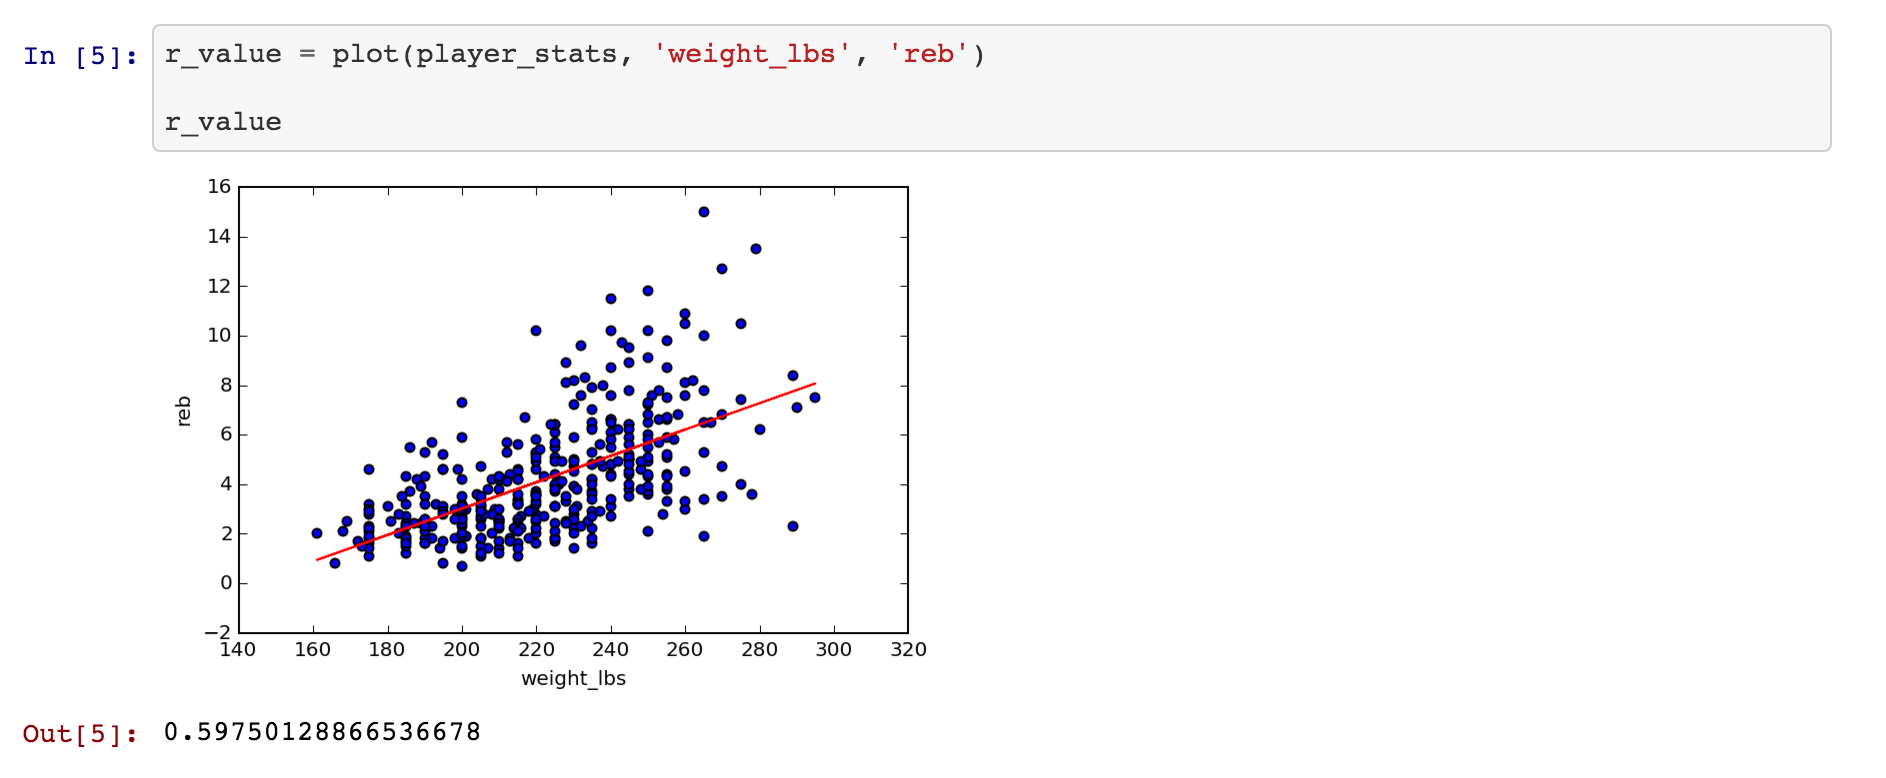
- comparing two stat categories in a Q->Q scatter plots with best fit linear regression lines and correlation coefficients (also adding 3rd C dimension by labeling player positions)
- some C->Q comparisons of stats across guard / forward / center positions
IPython, numpy and scipy continue to shine, was really easy to find examples of making scatterplots and fitting regression lines, and has been fun getting my Python legs back. Check out the notebook here, here's a little example comparing the relationship between weight and rebounds per game: