Grokking probability fundamentals paying off, stats problem set progress
Seeing some benefits of grokking probability fundamentals
I've started re-listening to the introductions to each episode of The Talking Machines podcast as Ryan Adams does such a good job explaining something interesting each time. In Episode 6 He talks about Determinantal Point Processes. The paper linked to in the episode notes describes a DPP formally:
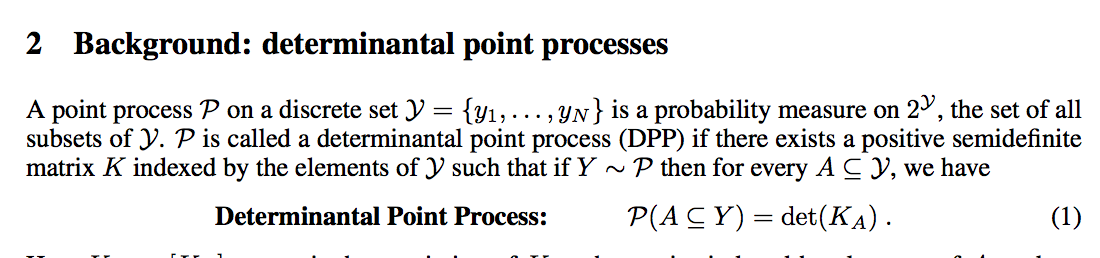
This is much easier to read now given my study of random variables and probability measures as it follows the template of describing how it maps subsets of elements in an outcome space to real numbers (in this case using determinants of a matrix). I can't say the rest of the paper is smooth reading for me; I'll need more background on graphical models, but this experience gives me reassurance that all this time spent on the fundamentals will pay off and that jumping directly to more advanced topics would not be a great idea. That said, I'm feeling closer to ready to perhaps jump right into a study of graphical models.
I also spent some time re-reading chapters of the All of Statistics book Saturday evening before going to sleep; fluency in mathematical notation and concepts of probability is starting to make this seem possible as the notation is beginning to quickly map to already understood chunks in my head.
Another take on random variables
I had a detour this morning looking up resources for probabalistic graphical models, and it seems like the best text is Probabilistic Graphical Models Principles Computation (download). In its 'foundations' chapter, it describes random variables:
Our discussion of probability distributions deals with events. Formally, we can consider any event from the set of measurable events. The description of events is in terms of sets of outcomes. In many cases, however, it would be more natural to consider attributes of the outcome. For example, if we consider a patient, we might consider attributes such as “age,” “gender,” and “smoking history” that are relevant for assigning probability over possible diseases and symptoms. We would like then consider events such as “age > 55, heavy smoking history, and suffers from repeated cough.”
To use a concrete example, consider again a distribution over a population of students in a course. Suppose that we want to reason about the intelligence of students, their final grades, and so forth. We can use an event such as GradeA to denote the subset of students that received the grade A and use it in our formulation. However, this discussion becomes rather cumbersome if we also want to consider students with grade B, students with grade C, and so on. Instead, we would like to consider a way of directly referring to a student’s grade in a clean, mathematical way.
The formal machinery for discussing attributes and their values in different outcomes are random variables. A random variable is a way of reporting an attribute of the outcome. For example, suppose we have a random variable Grade that reports the final grade of a student, then the statement P (Grade = A) is another notation for P (GradeA).
This solidifies the connection to every day data-sets: random variables are what assign the value to the columns of each row for each feature.
Problem set
I made some modest progress on the first homework assignment of the all of stats book in proving the "Continuity of Probabilities".