Plotting my curriculum and diving into Stanford's probability and stats course.
Today I'm continuing to plot my big picture curriculum focusing on three areas:
- probability and statistics fundamentals
- applied ML / inference techniques
- capstone: pick something cool I want to be able to do and work backwards
I've previously gathered a lot of relevant materials, but today discovered an additional resource for basic stats: Stanford's free course. It is a very basic intro but I believe I can learn something from it as I also work through problem sets from the text "All of Statistics" that I found from CMU's course from the author of the and its more introductory CS counterpart CS 36-700 (note: I found materials elsewhere online months ago that now no longer appear to be online).
One question I got wrong off the bat in this basic stats course was in determining whether the variable 'ZipCode' from a dataset was categorical or quantitative: I chose 'quantitative' without thinking too much because there are a lot of possible options and I was thinking categorical would be a smaller finite set of choices, but this is wrong; zipcodes can't be summarized quantitatively, e.g no 'average' of zipcodes, so it is a categorical variable. Kind of embarrassing I didn't get this right, but hey, this is why it's good to start with the basics even as I dive into more advanced stuff in parallel.
Another course I took another look at today was Stanford's statistical learning course. It covers some of the same techniques I will be looking at as I work through Python Machine Learning. I will check back to see if any of the videos help in my understanding as I proceed.
Stats basics
Today I covered basic exploratory analysis of categorical and continuous variables (up through measures of spread here.
Concepts:
- data and variables
- summarizing data: histograms, measures of center (mean, mode, median), measures of spread and outliers
Skills & Techniques:
- determine whether a variable is categorical or quantitative (and more granularly, whether it is nominal, ordinal, interval or ratio)
- plot a histogram of a categorical variable in bar or pie form
- plot a histogram of a quantitative variable
- produce a stem plot of a quantitative variable
- upon viewing a histogram, describe the data sets:
- shape: uniform, unimodal, bi-modal
- symmetry: centered, skewed right, skewed left
- determine the mode, median, mean of a quantitative variable (from the raw data or a histogram)
- have intuition about the relationship between median and mean based on its histogram (e.g skewed left will have a higher mean than median)
- determine the range of a dataset (from the raw data or a histogram)
- determine the interquartile range (IQR) of a data set
- determine whether a data point is considered an outlier based on its relationship to Q1, Q3 and the IQR (e.g if less than Q1 - 1.5 * IQR)
- construct a box plot of a data set based in its min, q1, median, q3, max
- develop intuition for a dataset by viewing its box plot
- compare two or more datasets by plotting their box plots on the same graph next to each other
- calculate the standard deviation of a data set
Overview
There's a nice diagram to outline the course that puts everything about the course into context. The course covers 4 aspects of statistics:
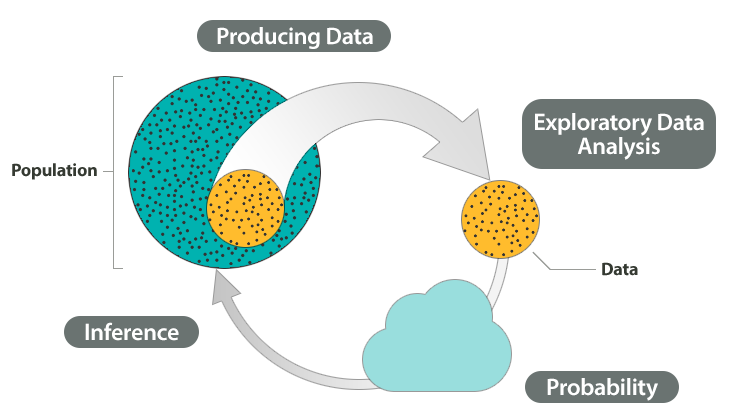
Getting / producing data: sampling from a population of "all" data to get a dataset.
Exploratory data analysis (EDA): sizing up and summarizing the data set to get a feel for its characteristics.
3 & 4: Probability and inference: drawing conclusions about the entire population from the observed data collected in our sample.
Data and variables
Data are pieces of information about an individual or object, and these pieces are organized into variables. A variable is a characteristic of an individual / object, such as eye color, age, number of hours spent studying for the final exam last for a particular course last fall, etc.
Note: these are not to be confused with random variables, which assigns values to outcomes of a random experiment.
Note: I think the word I'd usually use for 'variable' here is 'feature'.
Variables can be classified as categorical or quantitative. Categorical variables classify an object into a distinct set of values which are not ordered or comparable in magnitude. Continuous variables have values that can be compared and quantified; taking the average for instance.
Variables can be further classified into 4 progressively quantifiable types by their scale of measurement.
- nominal: basic discrete categories
- ordinal: can be ordered
- interval: can be ordered, difference between two can be quantified
- ratio: has notion of zero value. Can find the mean.
Summarizing data: examining distributions
One categorical variable
Histograms: number of items in each category.
One quantitative variable
- histograms but need to pick bins
- stem plots: an algorithm for creating a histogram like visualization by slicing by decimals, which guides you to choosing the size of the bins. Also useful because it preserves the data (each datum is stacked and visible in the plot)
- measures of center: mean, median mode. Mean is only appropriate when data is symmetric without outliers, median is better otherwise
- measures of range
- range
- inter-quartile range: median of top half - median of bottom half = Q3 - Q1
- data below q1 - 1.5*IQR or above q3 + 1.5 IQR considered outliers
- outliers shouldn't necessarily be discarded; only if they are suspected to be due to conditions that will not be repeated again or through error in collection. Outliers may be essential to the data, e.g a high magnitude earthquake.
- box plots: visual presentation of min, q1, median, q3, max (the "five number summary") constructed by drawing dashes for each of these 5 summary numbers, and then a box around the q1 through q3.
- standard deviation